There does not exist a cookie-cutter approach to treating patients with cancer, due to a multitude of patient-related factors, such as gender, race, age, biomarkers, and comorbidities. Despite these factors, which may affect how individuals respond to specific therapeutic protocols, there are general guidelines, including those published by the National Comprehensive Cancer Network (NCCN),1 which can be used to help guide treatment practices to promote optimal clinical outcomes. Although clinicians have access to these guidelines and are aware of which treatment regimens are generally prescribed to treat specific types of cancer, they do not have insights into how other clinicians are treating similar cases.
Analytics Based on Real-World Data
As precision medicine continues to evolve in the oncology space and as electronic medical records become more flexible in terms of the breadth of information they collect, we are seeing exponential growth in the data analytics space. Analytics on real-world data provide real-world evidence that can be leveraged to make informed decisions. Not only is it important for clinicians to have access to all of their information in a user-friendly platform, but it is also helpful for them to be able to obtain an aggregate view of what is happening among a certain cancer population. Providing summary dashboards to clinicians gives them a quick overview of which regimens are being used to treat their target population. This information can be further examined as real-world evidence of treatment options that may be viable alternatives when standard regimens are not as effective.
Various stakeholders can find the utility of dashboards that provide a high-level view of which treatments are being administered to specific populations. Two key stakeholders that could derive immediate benefit from these types of dashboards are clinicians and pharmaceutical companies, with patients potentially receiving the ultimate benefit of more personalized treatment and care. For example, a patient diagnosed with metastatic urothelial carcinoma will typically be prescribed a platinum-based combination chemotherapy as first-line treatment, which is consistent with NCCN guidelines. However, there may be a subpopulation of patients who were initiated on a different regimen as first-line therapy. From a clinician’s point of view, understanding more about the sub-population that was prescribed a different treatment may provide insights into a particular patient and existing health nuances that make alternative regimens a better choice. Pharmaceutical companies can also use this information to develop educational campaigns and target specific providers with additional resources to ensure their prescribing practices are aligned with NCCN guidelines.
Data Visualization of Treatment
Two dashboards have been developed to close knowledge gaps and highlight treatment patterns. The Sankey dashboard illustrates treatment progression from first-line to second-line treatment. The Market Share dashboard displays which treatment was initiated by month. Although both dashboards focus on similar information, individually, they address specific use cases and are valuable tools to provide insights into the patient population from a treatment perspective.
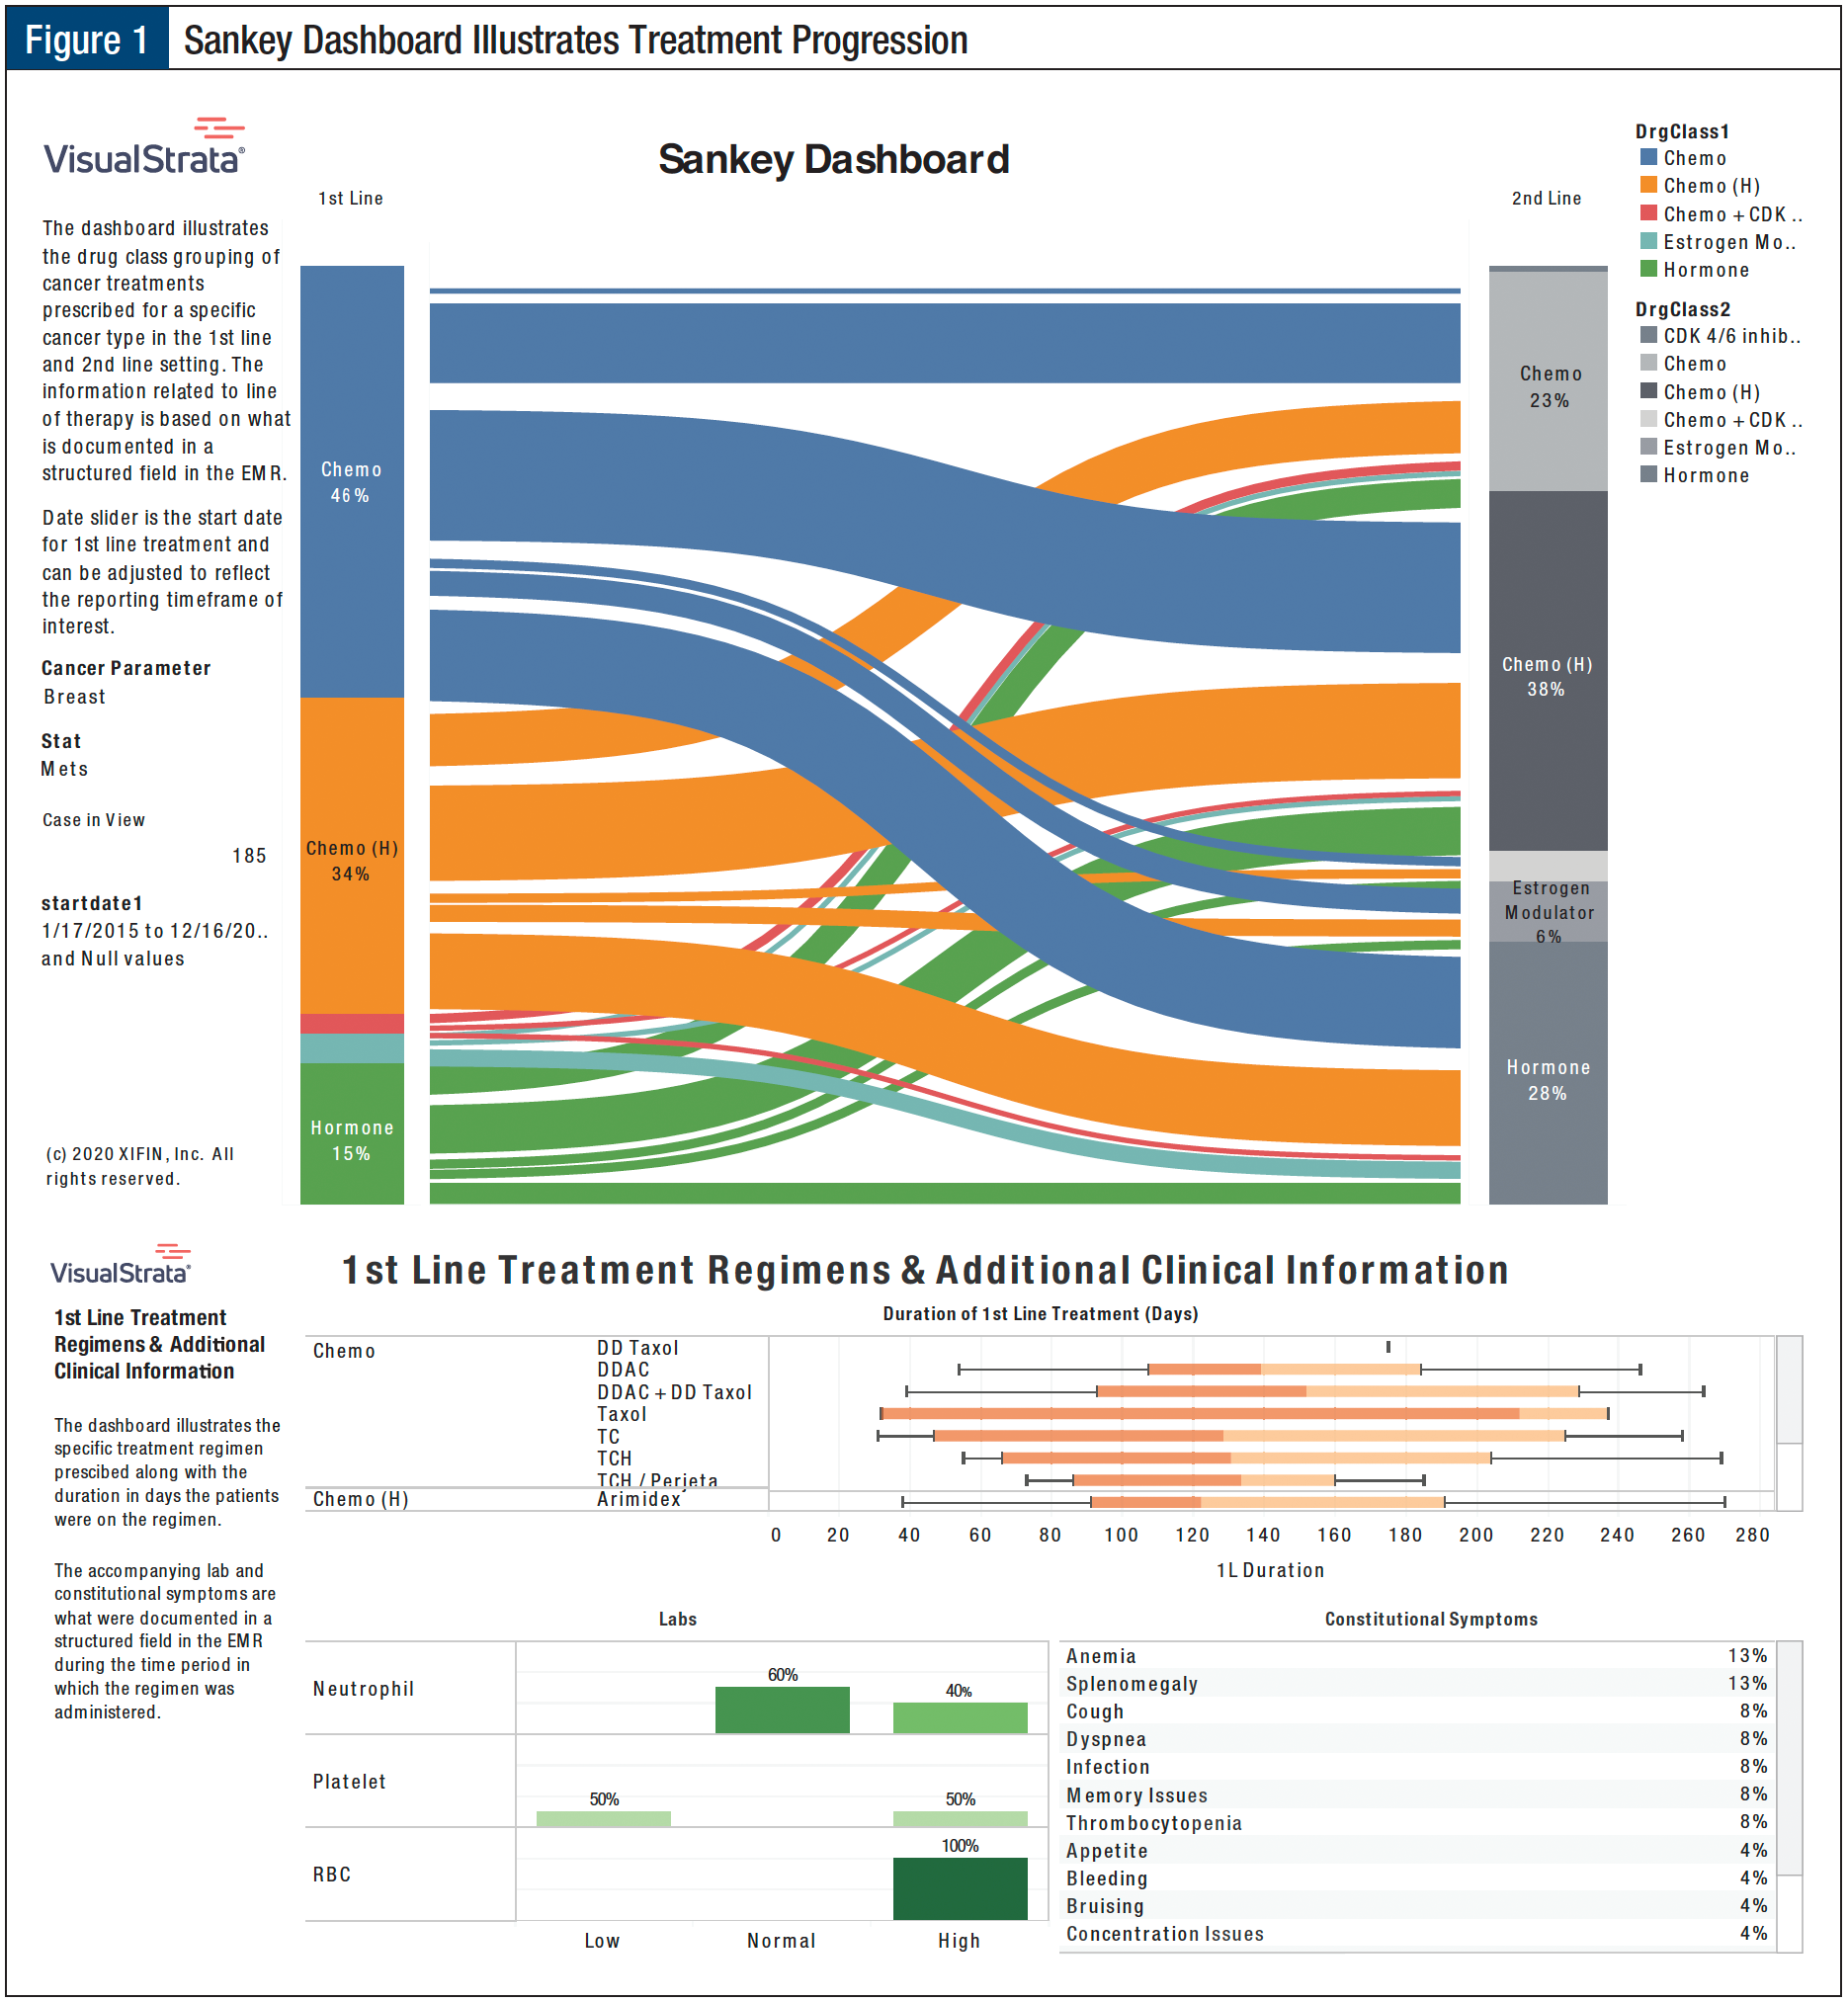
Sankey Dashboard
The Sankey dashboard (Figure 1) traces the movement of patients from first-line to second-line treatment in the metastatic population over the span of 24 months by cancer type. In addition to showing which regimen a patient was administered in the first-line setting, the report also provides additional lab and clinical information related to constitutional symptoms experienced during treatment, such as anemia, constipation, night sweats, dyspnea, or abnormal levels related to platelet counts, red blood cells, and ferritin. This information, together with average duration of treatment, can give stakeholders an idea of how well a specific product is performing in that space and which side effects most patients experience after treatment. This data can be used to educate newly initiated patients on what to expect and to let clinicians know what types of labs should be tracked at each visit. Supplemental medication can also be prescribed for anticipated side effects to lessen negative experiences for patients. All this information is based on real-world evidence and is therefore more relevant than what occurred during clinical trials.
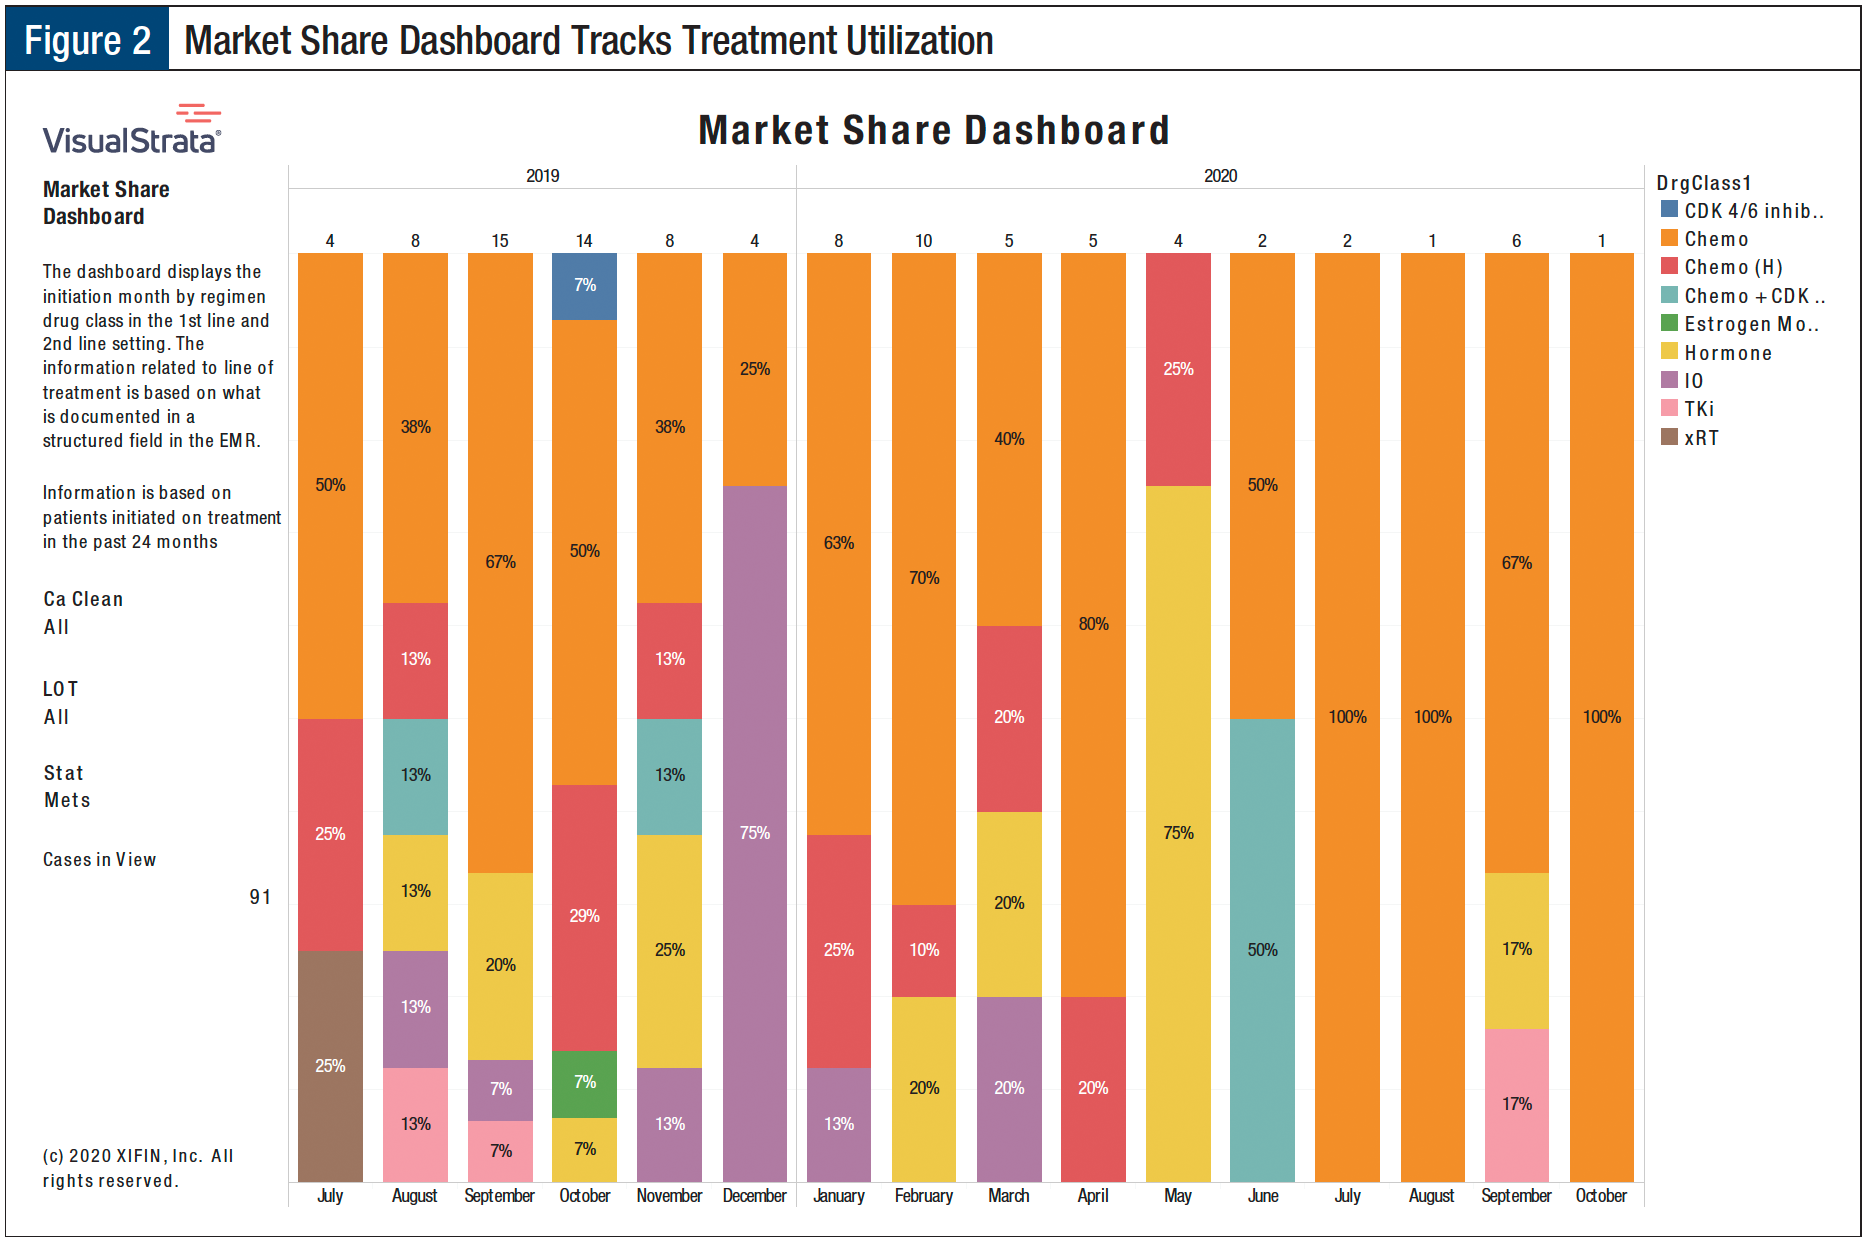
Market Share Dashboard
The Market Share dashboard (Figure 2) tracks the utilization of a regimen based on the initiation month over the course of 24 months. This dashboard is a useful tool for examining the treatment landscape prior to a new product coming to market and the adoption rate over time. With the ever-evolving therapeutic landscape in the oncology space, clinicians are challenged to keep up to date on novel treatments. Outdated information regarding a regimen could be evident if there is a low adoption rate after a new product is approved by the FDA. Educational messages can be crafted, and targeted campaigns can be developed to address this knowledge gap. If clinician prescribing practices differ from the NCCN guidelines, this dashboard will be able to identify those instances for further evaluation and possible intervention. Clinicians can evaluate how well a specific product is performing relative to biosimilars or other drugs in a similar class such as pembrolizumab (Keytruda) versus other immunotherapies that are developed based on PD-L1 expression.2 They can also gain insight on situational factors that could affect prescribing practices, such as with the COVID-19 pandemic. Most targeted therapies are oral medications, and during a time when patients delay or space out their office visits, the Market Share dashboard would display a decrease in chemotherapeutics that are given intravenously and an increase in those that are taken orally.
Conclusion
Clinicians require timely and meaningful information to effectively treat patients with cancer. Historically, guidance used to inform prescribing practices has been limited to NCCN guidelines and published reports from clinical trials. Incorporating real-world data and real-world evidence into the decision-making process is becoming a standard practice that should not be overlooked. Access to practice-level data in a dashboard view can be extremely valuable when more relevant data are needed to evaluate the current situation or in cases of rare cancer types where formal clinical guidelines have yet to be established.
References
- National Comprehensive Cancer Network. About clinical practice guidelines. www.nccn.org/guidelines/guidelines-process/about-nccn-clinical-practice-guidelines. Accessed August 6, 2021.
- DePolo J. FDA approves immunotherapy Keytruda for PD-L1-positive triple-negative breast cancer. November 13, 2020. www.breastcancer.org/research-news/fda-approves-keytruda-for-pd-l1-pos-tnbc. Accessed August 6, 2021.